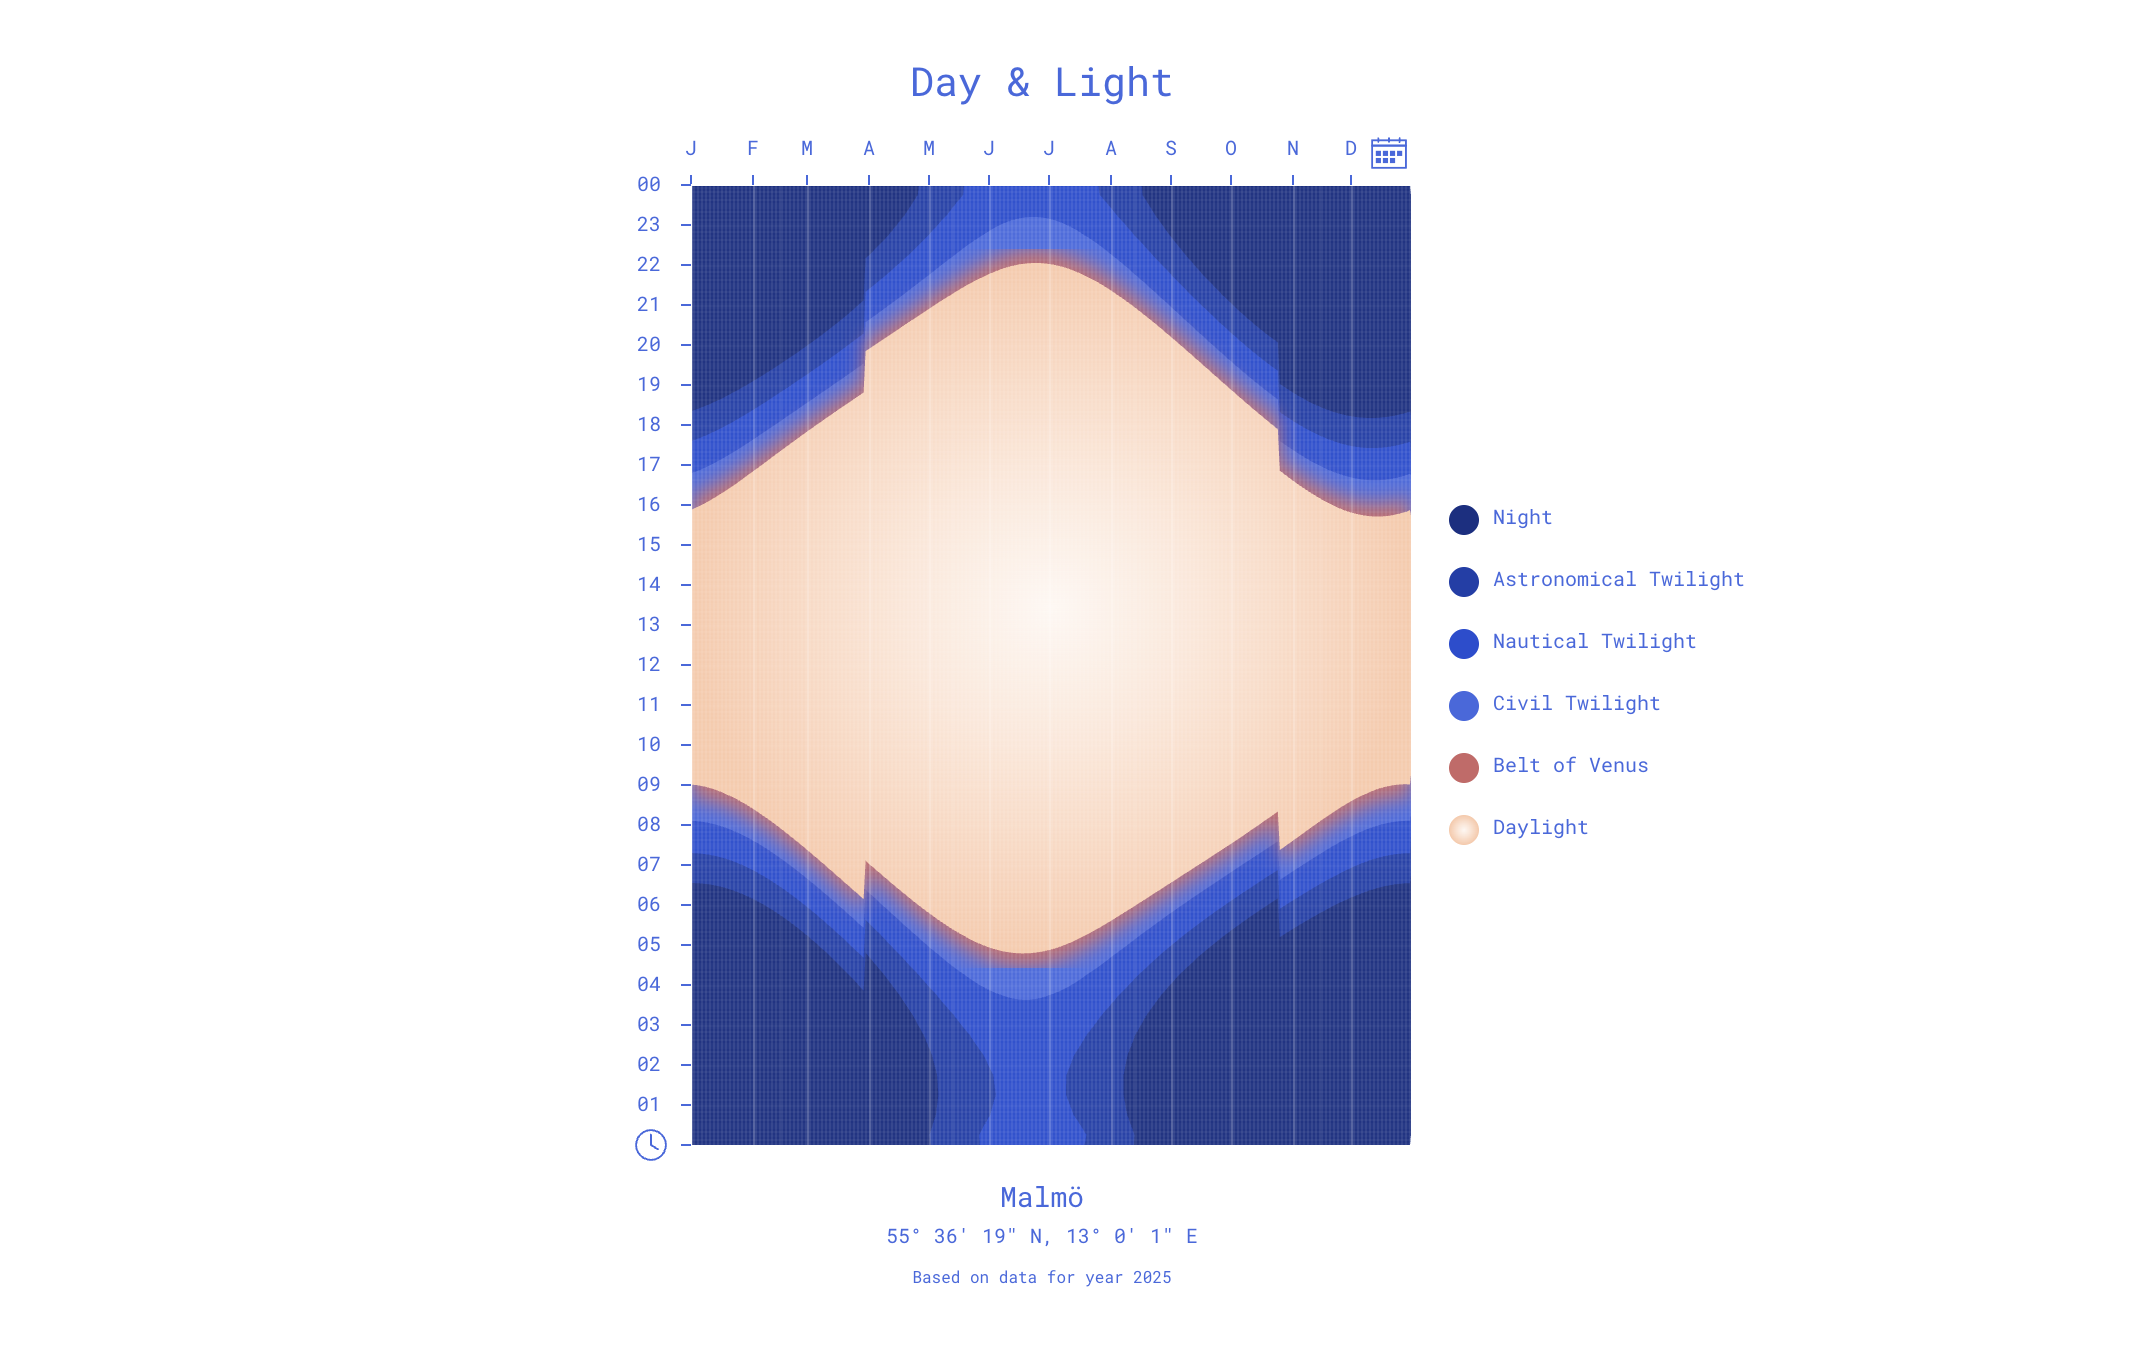
Day & Light
When you live at the outer end of a hemisphere, daylight becomes both a fascination and a struggle. This interactive data visualization lets you see when the sun rises and sets each day throughout the year for any chosen location. It was created as a way to focus on daylight and encourage hope during the darker months.

The project began as a printed poster, meant to brighten the days of my colleague Anna Goffe and myself. The fully digital version came later, essentially reverse-engineered from the poster, and brought new challenges for small screens. These were addressed by creating different resolutions for various display sizes and experimenting with legend proportions. The visualization has since been featured in museum shops, home interior stores, and even appears to be a favorite among a few real estate agents.
The project also revealed striking contrasts between different parts of the globe, try Svalbard for a dramatic example!
Technical implementation in Svelte and D3.js, concept and visual design.